abstract
1.
INTRODUCTION………………………………..…..
P. 1
2
.GEOLOGICAL SETTING…………………………..
P. 2
3.
SAMPLING………………………………..…………
P. 3
4.
LABORATORY
ANALYSIS…………………………
P. 4
5. MAGNETOMINERALOGY………..…….……..
P. 4
6. MAGNETOSTRATIGRAPHY……………………..
P. 6
7. BIOSTRATIGRAPHY………………………………
P.
10
8. SEQUENCE
STRATIGRAPHY……………………
P. 11
9. SECONDARY MAGNETIC COMPONENTS……
P.25
10
CONCLUSION………………………………..……
P.28
references
Fig.1 Locality map
…....................................................... p. 1
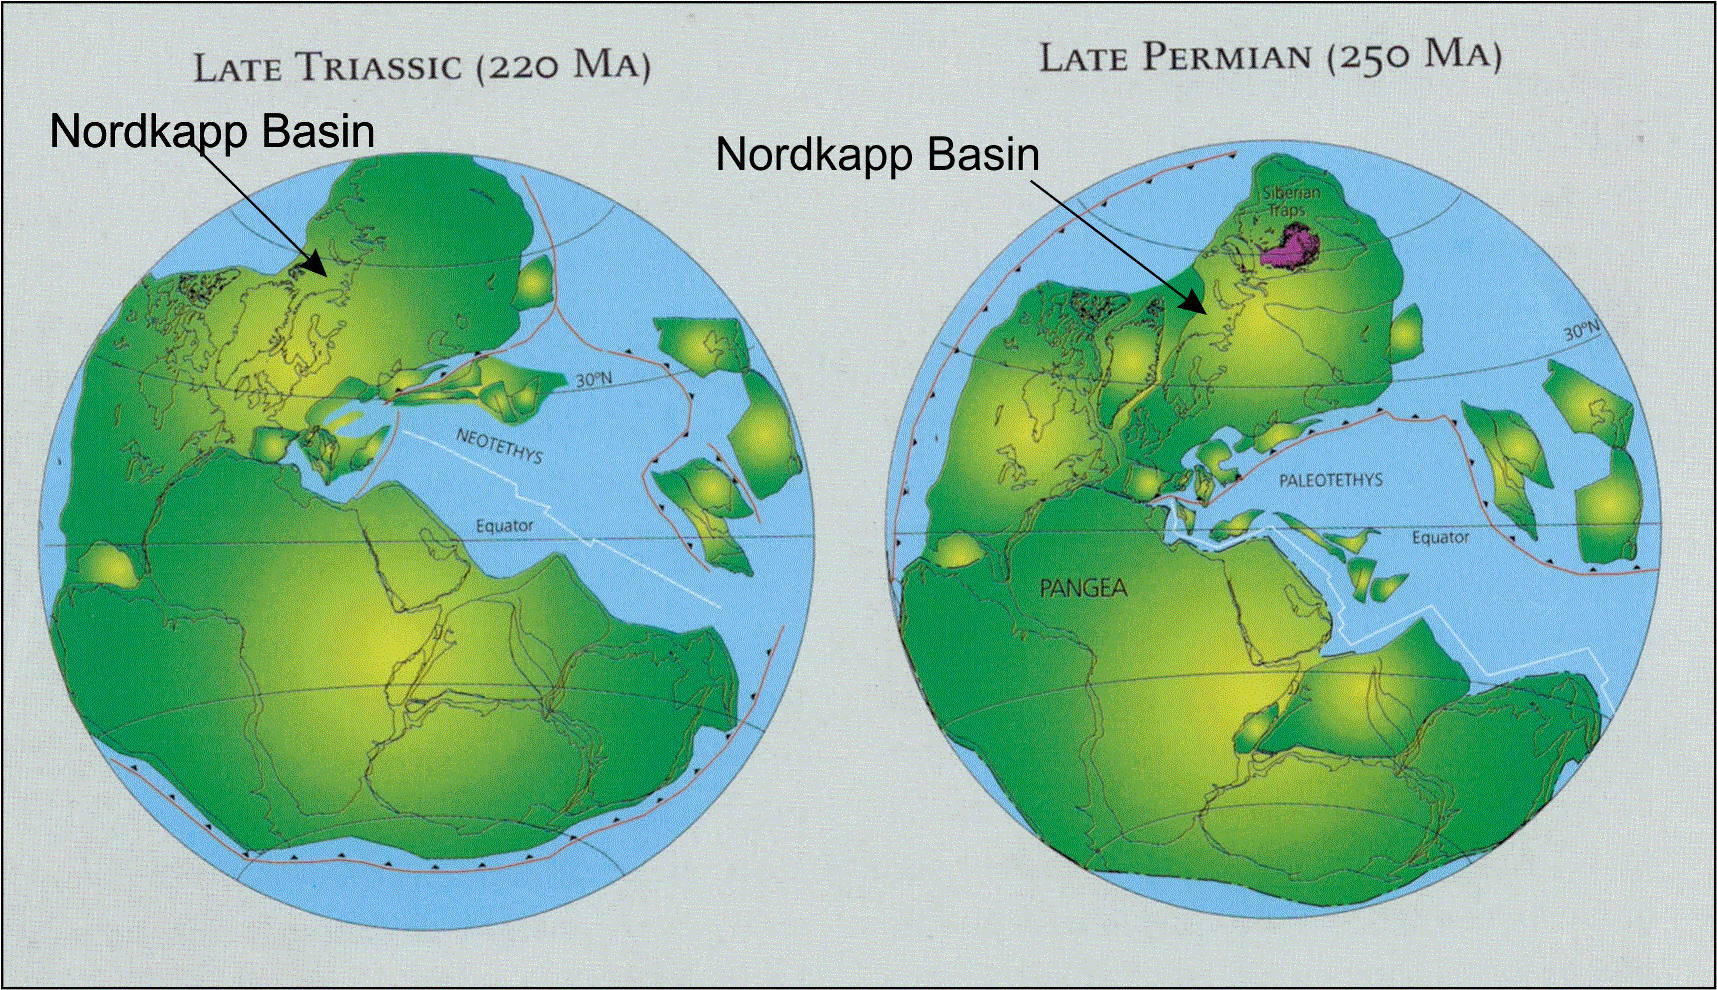
Fig.2 Palaeogeographic
position of
area......................................
p.
3
Fig.3 List of the cores
analysed................................................... p. 4
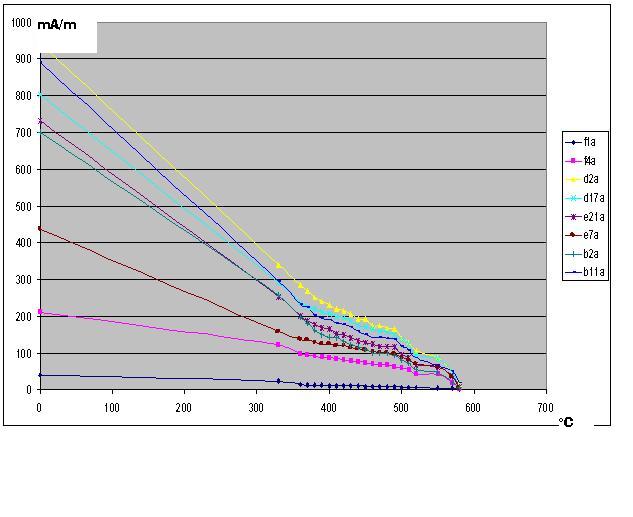
Fig.4 Demagnetisation of IRM
samples......................................
p.5
Fig.5 IRM plot of
selected samples............................................. p.6
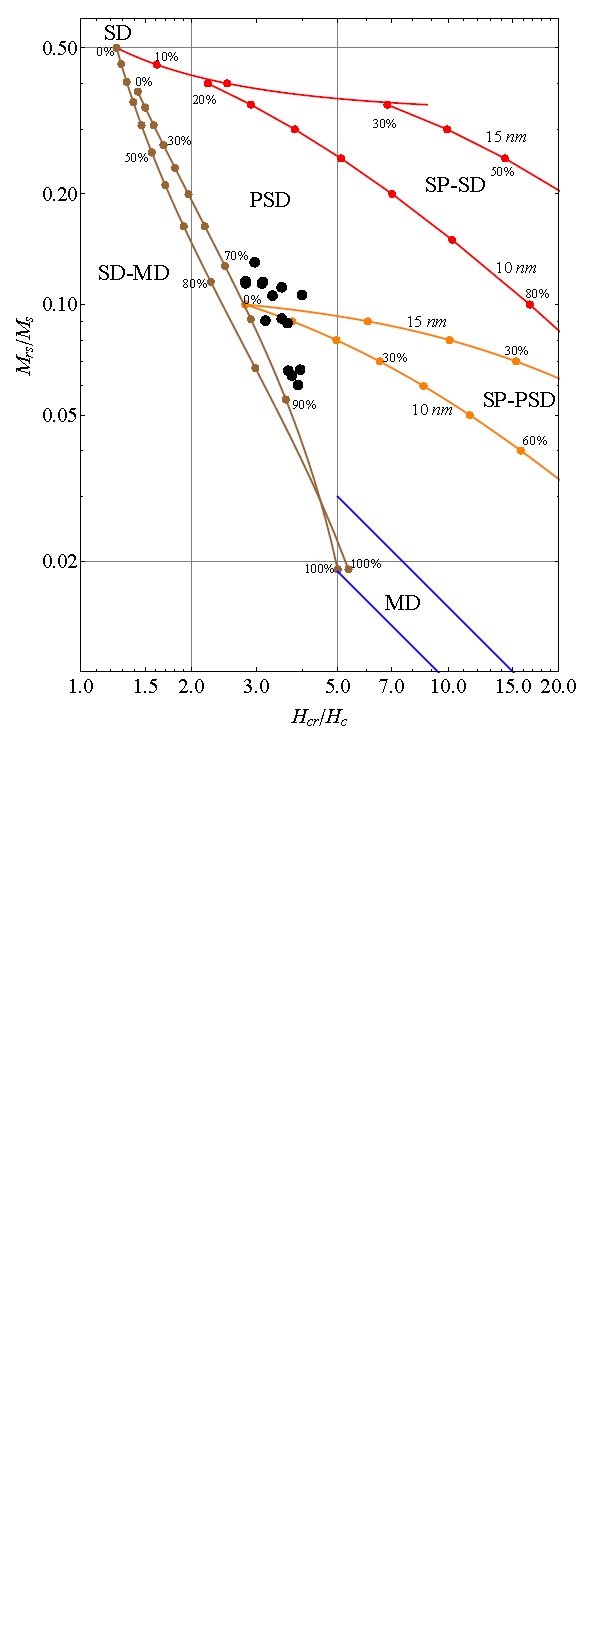
Fig.6 Dayplot of selected
samples...............................................
p.7
Fig.7 List of polarity
boundaries................................................... p.8
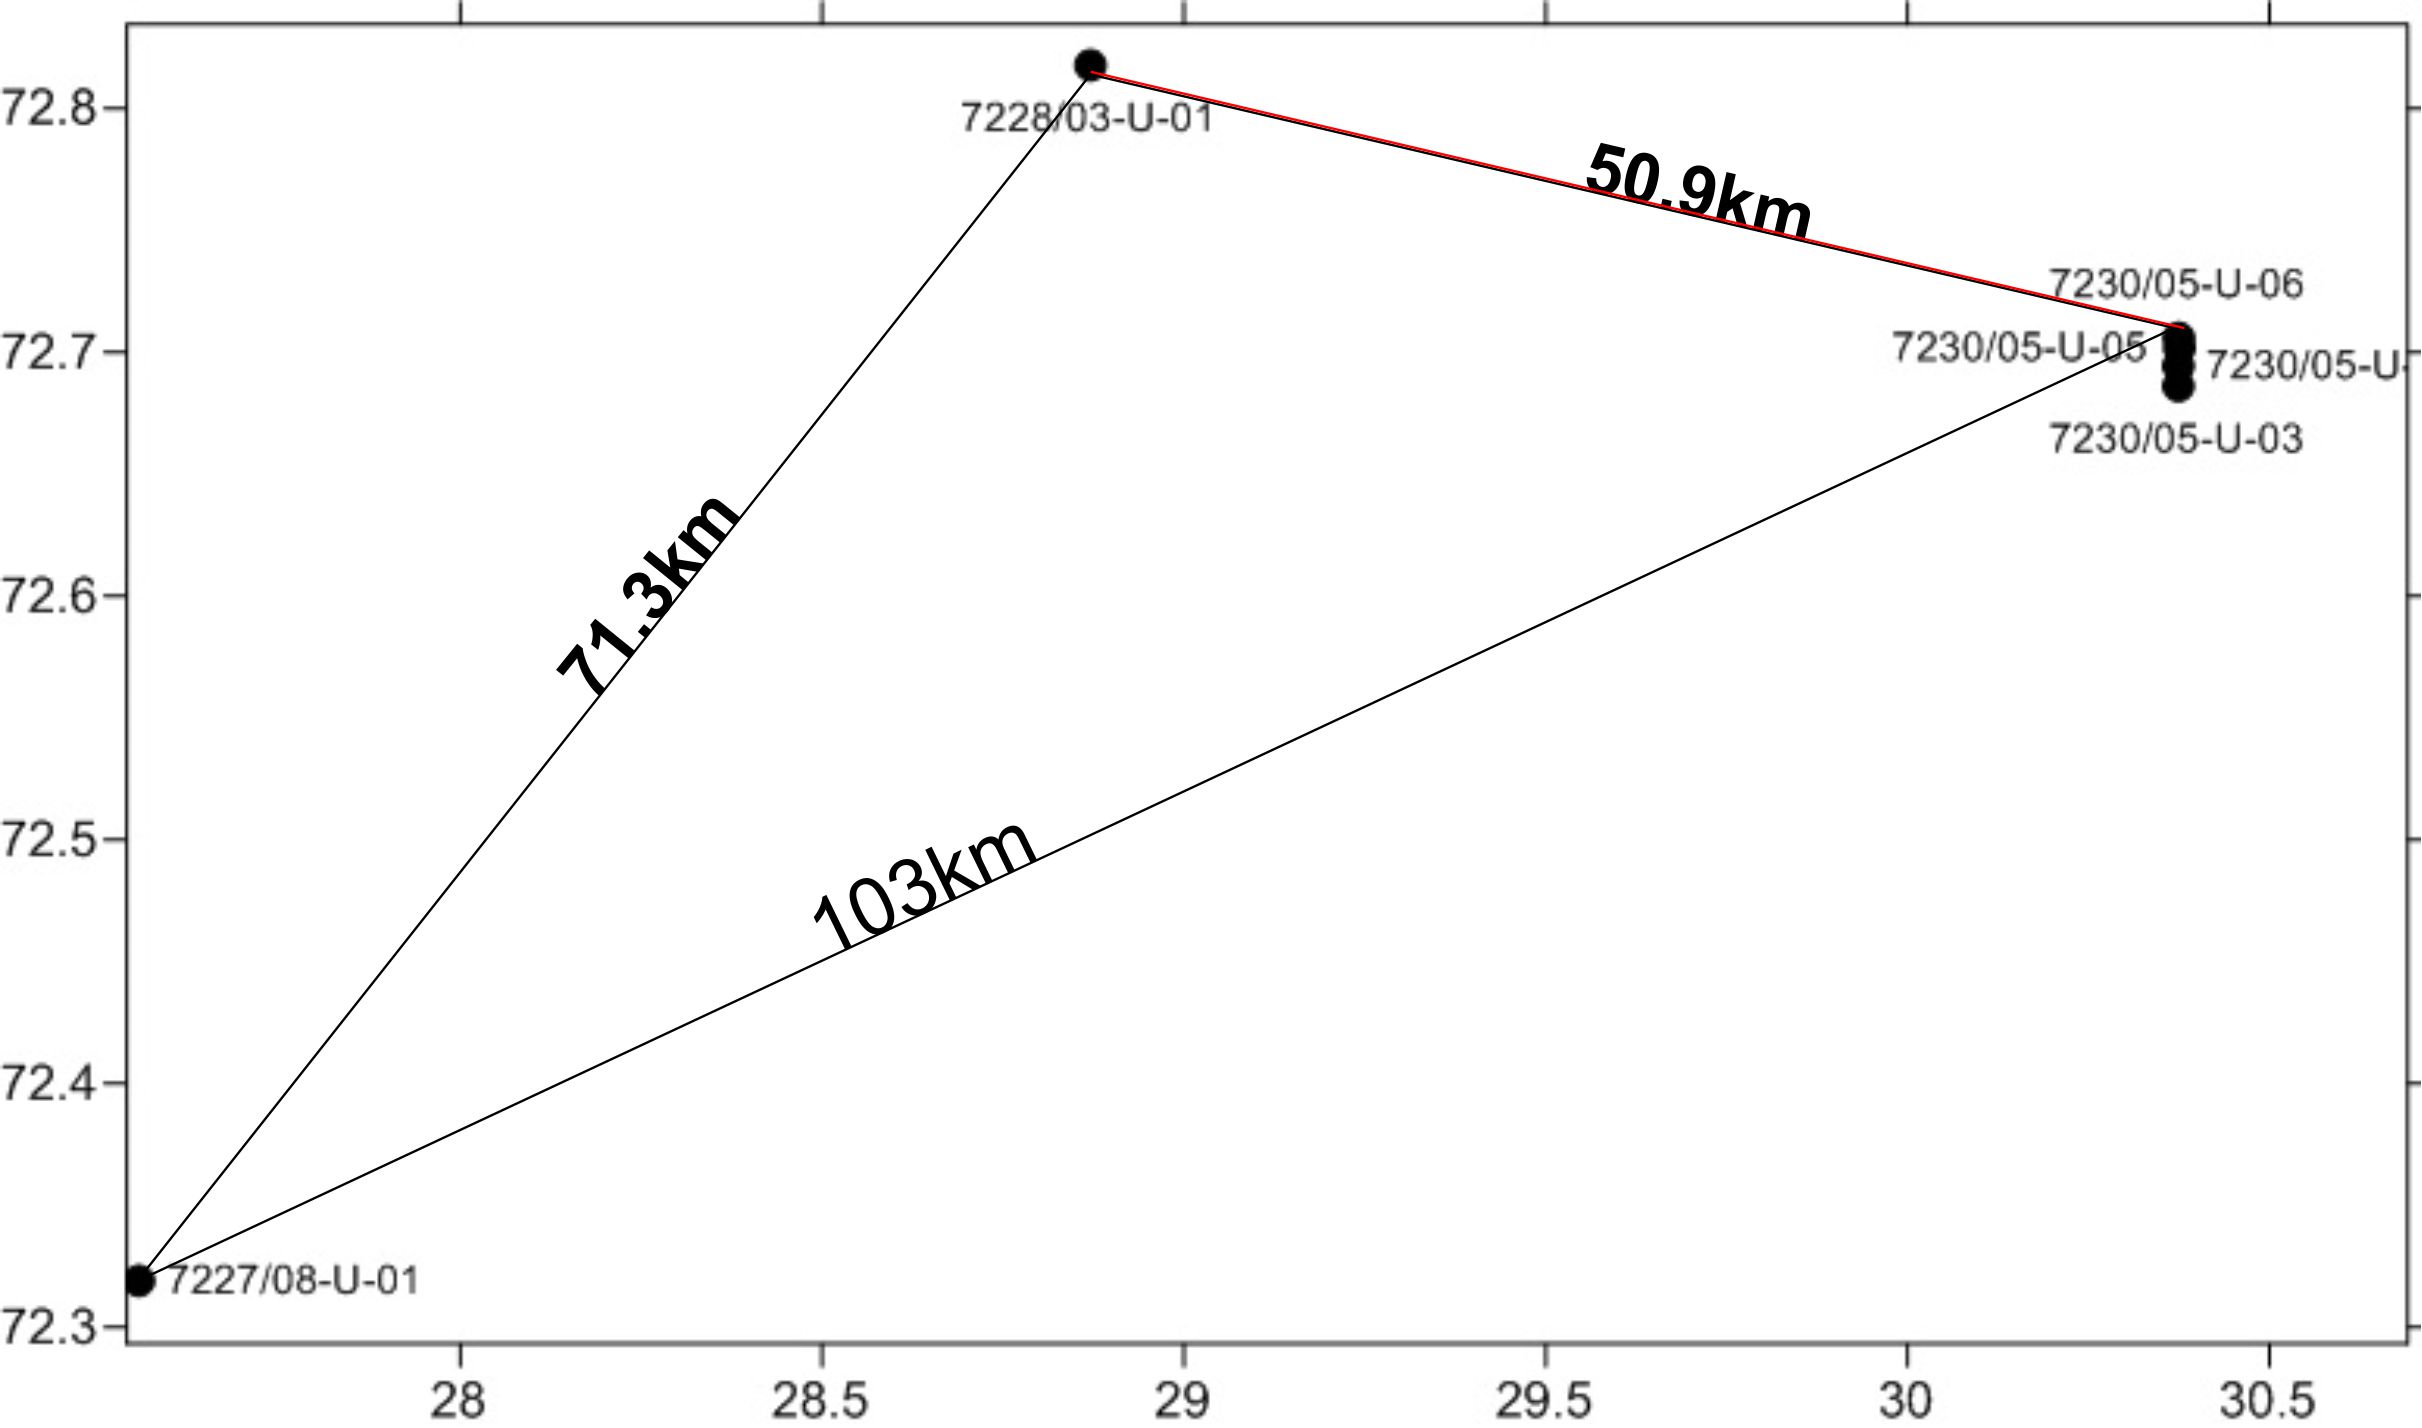
Fig.8 Drilling position of wells 7231/05-U-03, 04, 05
and 06..... p.10
Fig.9 Geographical
position of all six
wells..................................
p.10
Fig.10 List of sequence
boundaries..............................................
p.12
Fig.11 Well 7227/03-U-01
Polarity Log.......................................
p.13
Fig.12 Well
72280/08-U-01 Polarity
Log......................................
p.14
Fig.13 Well 7230/05-U-03
Polarity
Log....................................
p.15
Fig.14 Well 7230/05-U-04
Polarity
Log...................................
p.16
Fig.15 Well 7230/05-U-05
Polarity
Log....................................
p.17
Fig.16 Well 7230/05-U-06
Polarity
Log.....................................
p.18
Fig.17 Establishment of
the
composite polarity log, MPS..... .......
p.
19
Fig.18 Correlation of
the MPS to
the GPTS...............................
p.
20
Fig 19
Sequencestratigraphic
correlation chart.............................
p.
21
Fig.20 Subsidence
chart............................................................... p. 22
Fig.21 Suggested
correlation of
the Upper Triassic intervals........
p.
23
Fig.22xxxxxxxxxxxxxxxxxxxxxxxxxxxxxxxxxxxxx
......................... p. 25
Fig.23
xxxxxxxxxxxxxxxxxxxxxxxxxxx......................................... p.
26
Fig.24 Temperature &
Depth in
the Barents Sea............................
p.27
Fig.25 Climate curve for
the Bruhnes
Chron....................................
p.27