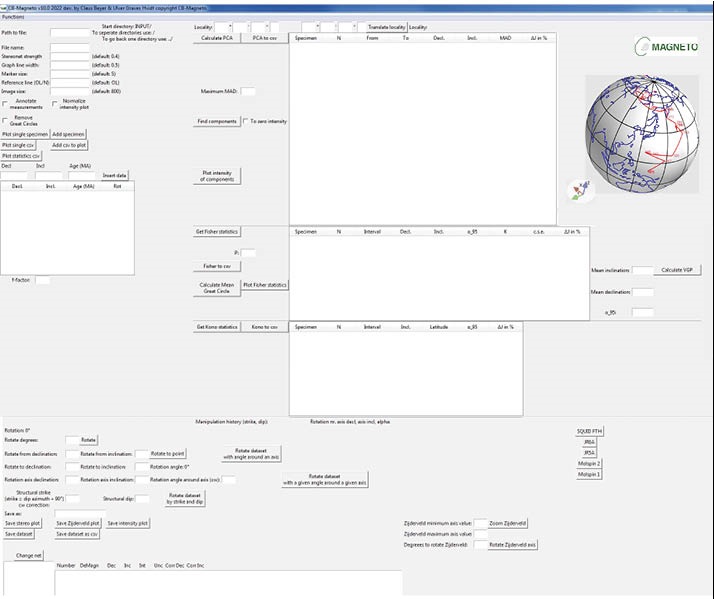
Our processing program developed during the recent years can be
coupled directly to our magnetometers and makes
it thereby easier for the operator to follow the results of the
measurements realtime on the variuos diagrams and plots.
It has made it easier and quicker to get the results and create the
report for the client. The program includes all the
common statistic procedures used in palaeomagnetic investigations
in addition to magnetic susceptibility analyses. Results
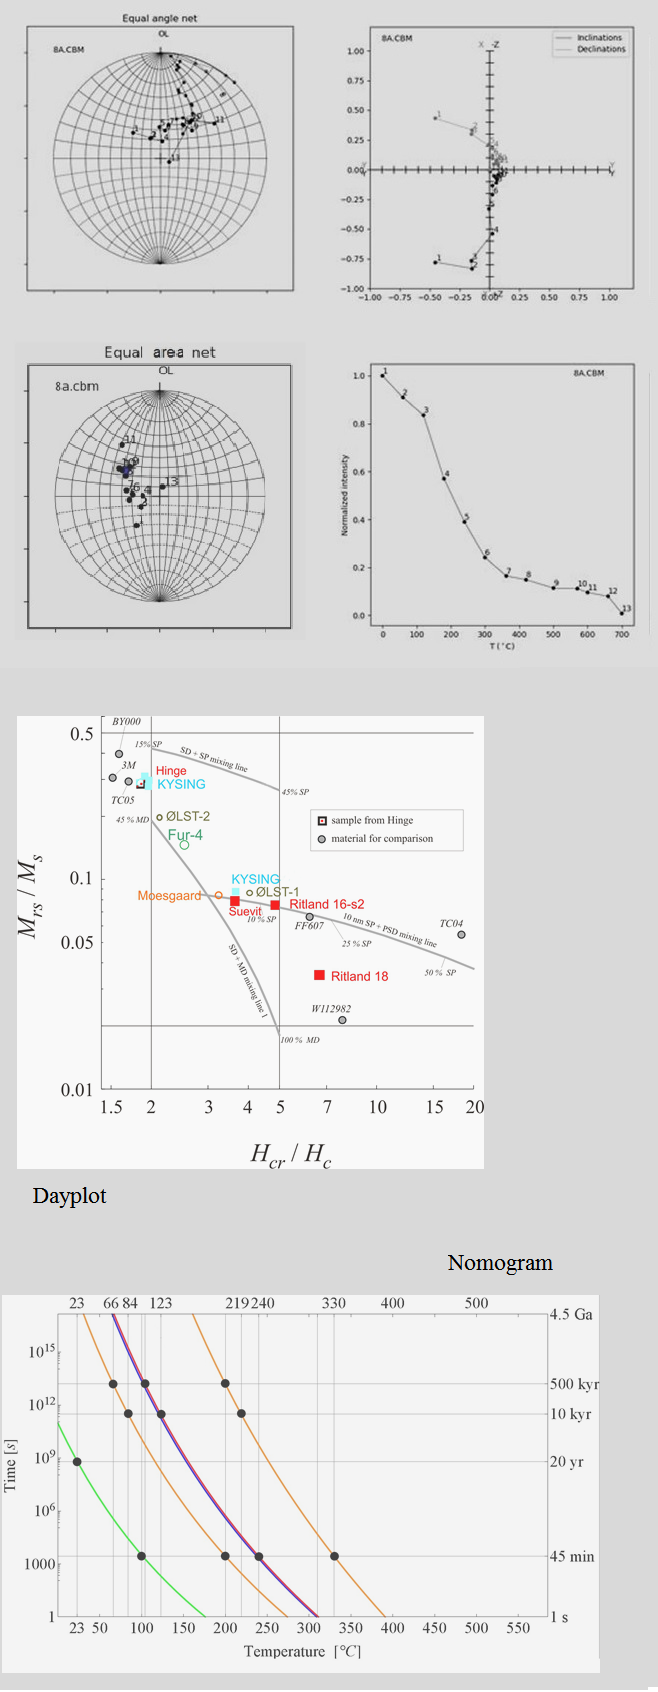
Data are displayed in various plots.In combination with the GPTS, the
APWP for various
continents, other time relevant
analyses etc, the program makes it possible to date sediment, determine
sedimentation
rates, accumulation rates, time intervals,
palaeotemperatures, geographic orientation, tectonic rotation,
palaeocurrent directions etc.etc.
Examples of plots and diagrams:


